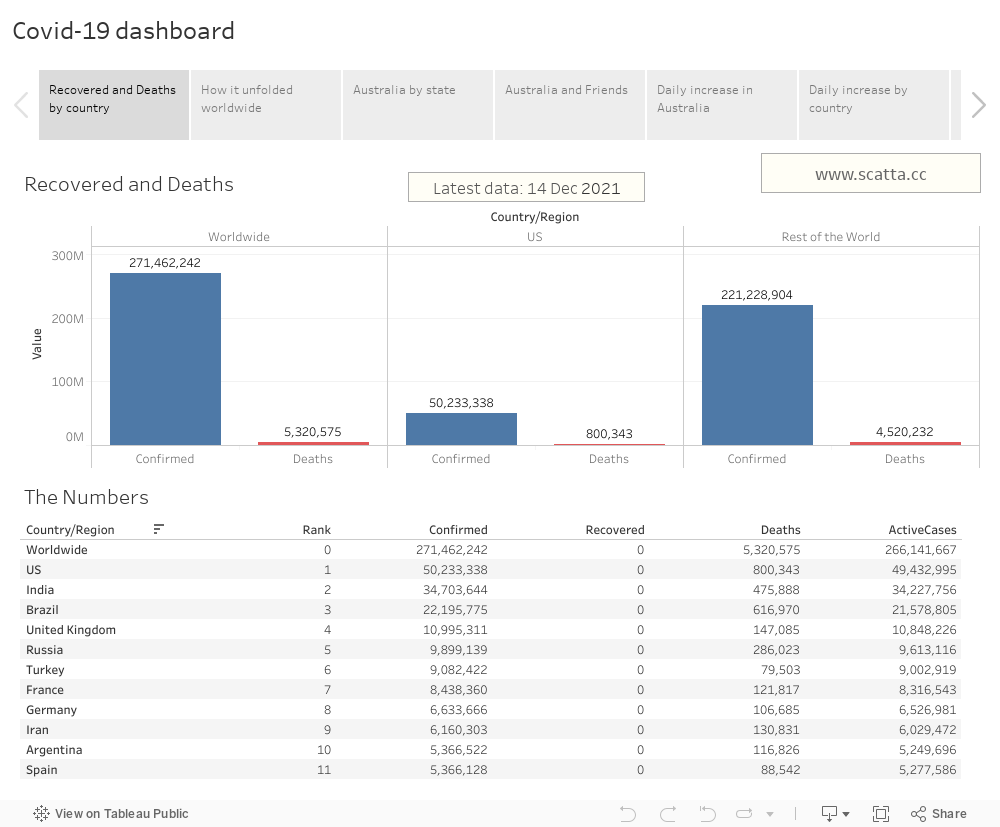
Global CoVid-19 dashboard
This post contains interactive charts which are best viewed on a large screen.
The Python code
If you’re interested in building this in Tableau yourself, below is my script to download and collate all the csv data files into a format Tableau understands.
The raw files are in wide format (each column represents a day) so the code will perform the trasformation to long format as well.
import numpy as numpy
import pandas as pd

import urllib.request

url = "https://raw.githubusercontent.com/CSSEGISandData/COVID-19/master/csse_covid_19_data/csse_covid_19_time_series/time_series_19-covid-Confirmed.csv"
url = "https://raw.githubusercontent.com/CSSEGISandData/COVID-19/master/csse_covid_19_data/csse_covid_19_time_series/time_series_covid19_confirmed_global.csv"
print ("download start!")
filename, headers = urllib.request.urlretrieve(url, filename="Confirmed.csv")
url = "https://raw.githubusercontent.com/CSSEGISandData/COVID-19/master/csse_covid_19_data/csse_covid_19_time_series/time_series_19-covid-Deaths.csv"
url = "https://raw.githubusercontent.com/CSSEGISandData/COVID-19/master/csse_covid_19_data/csse_covid_19_time_series/time_series_covid19_deaths_global.csv"
filename, headers = urllib.request.urlretrieve(url, filename="Deaths.csv")
url = "https://raw.githubusercontent.com/CSSEGISandData/COVID-19/master/csse_covid_19_data/csse_covid_19_time_series/time_series_19-covid-Recovered.csv"
url = "https://raw.githubusercontent.com/CSSEGISandData/COVID-19/master/csse_covid_19_data/csse_covid_19_time_series/time_series_covid19_recovered_global.csv"
filename, headers = urllib.request.urlretrieve(url, filename="Recovered.csv")


print ("latest data download complete!")

print ('Processing data for Tableau ....')
dataSets = ['Confirmed', 'Recovered', 'Deaths']
#prefix = 'time_series_19-covid-'
prefix = ''
datas = {}

for data_name in dataSets:
    df = pd.read_csv(prefix + data_name + '.csv')
    max_ix = df.shape[0]
    # add all countries that are not US
    df.loc[max_ix,:]= df[df['Country/Region'] != 'US'].sum(axis=0)
    df.loc[max_ix,'Country/Region'] = 'Rest of the World'
    df.loc[max_ix+1,:]= df[df['Country/Region'] != 'Rest of the World'].sum(axis=0)
    df.loc[max_ix+1,'Country/Region'] = 'Worldwide'
    Cases = pd.melt(df, id_vars= ['Province/State','Country/Region','Lat','Long'],var_name='dateString',value_name=data_name)
    Cases[['month','day','year']] = Cases.dateString.str.split('/',expand=True)
    Cases['date'] = Cases.day + '/' + Cases.month + '/' + Cases.year
    Cases.drop(['month','day','year','dateString'],axis=1,inplace=True)
    datas[data_name] = Cases

# Join all 3 data sets
df_cd = datas['Confirmed'].merge(datas['Deaths'].loc[:,['Country/Region','Province/State','date','Deaths']], on=['Country/Region','Province/State', 'date'], how='left')
df = df_cd.merge(datas['Recovered'].loc[:,['Country/Region','Province/State','date','Recovered']], on=['Country/Region', 'Province/State','date'], how='outer')

df.sort_values(by=['Country/Region','Province/State'],inplace=True)
# Fill null values with previous data
df['Recovered'] = df['Recovered'].ffill()
df.to_csv('test.csv',index=False)
print(df.describe())
print('Lastest date: ')
print(df.loc[:,'date'].unique()[-1])

df.to_csv('CovData.csv',index=False)
Background
During the early phase of the Covid-19 outbreak, the media focused mostly on the number of new cases and deaths, and not much on recovery. It prompted me to go digging to understand the severity of the pandemic.
I found this dataset maintained by Johns Hopkins University and made a visualisation of this information in Tableau, with a focus on the reactions by the Australian government during this early phase of the pandemic.
There were certainly questionable decisions, e.g., incoming flights from Italy were only banned after the Grand Prix was canceled, despite the number of cases in Italy already exceeded 11,000 then. Travelers from Italy were banned after South Korea and Iran, which only had 4,300 and 1,000 cases respectively at the time they were banned.
It was also interesting that an economic stimulus package was announced in mid February, one month before those by the US and UK, and also before any significant border restrictions were enacted. Some suggest that the government had a better foresight of the economic downturn than our Western counterparts.
Link to the Python code I used to preprocess the data.
Link to the visualisation.