Christopher Nolan filmography infographic
Featured
Using cohort analysis to fix misleading product metrics
Olympic 2020 women sport climbing
Predicting Titanic survival with feature engineering and XGBoost
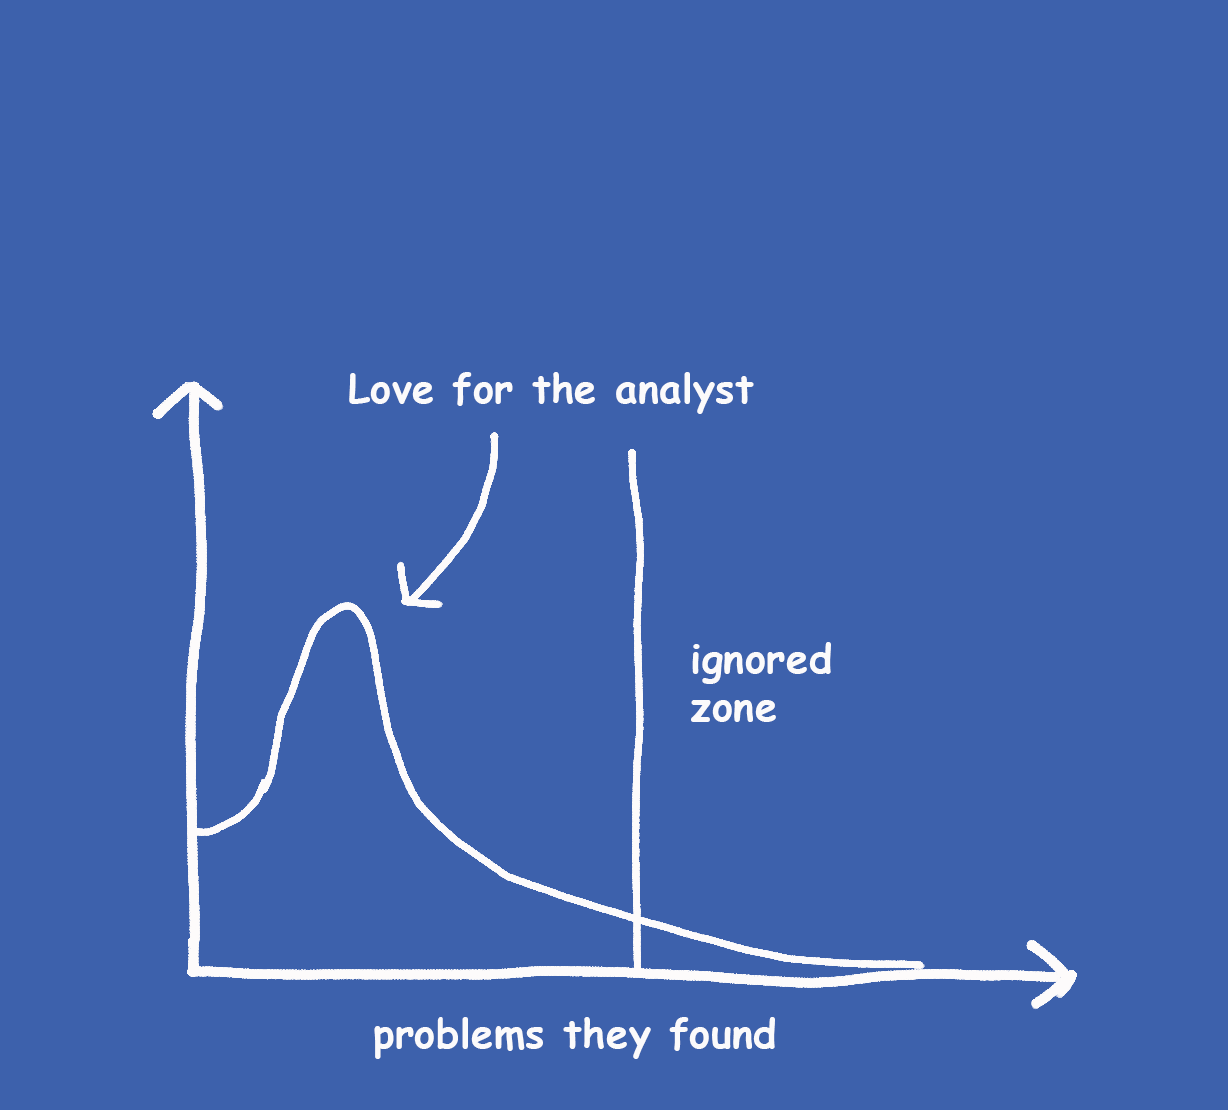
Why data analysts don't get the love (we think) we deserve
Tracking my attention span
Van Gogh and Deep Learning: How a machine sees arts
Infographic: the MoMA art collection
Goodreads' user rating data
Analysis: Australian stock market vs Gold and Silver
Training an AI to write food blogs
Global CoVid-19 dashboard
Scraping an Instagram public profile
Disease and prevention in 500 US cities: an interactive visualisation